Instrumenting Python apps with OpenTelemetry (and profiles) has been one of those “why didn’t I do this sooner?” upgrades for me. If you’re running FastAPI in production and mostly relying on logs, you’re basically debugging in the dark. Logs tell you that something broke. Traces show you the path. Metrics show you trends. But profiles? Profiles show you exactly where your CPU went to die.
The best part is how much you get for free. With OpenTelemetry, FastAPI, HTTP clients, async DB drivers, Redis — all of it can be auto-instrumented. You add a few dependencies, flip a couple configs, and suddenly you have traces and metrics flowing without rewriting your whole codebase.
This post is about setting that up: instrumenting a Python app with OpenTelemetry and wiring in profiling so traces and CPU data live together. Once you’ve debugged performance this way, going back to logs-only feels prehistoric.
If you want to skip straight to the code, there’s a ready-made template here.
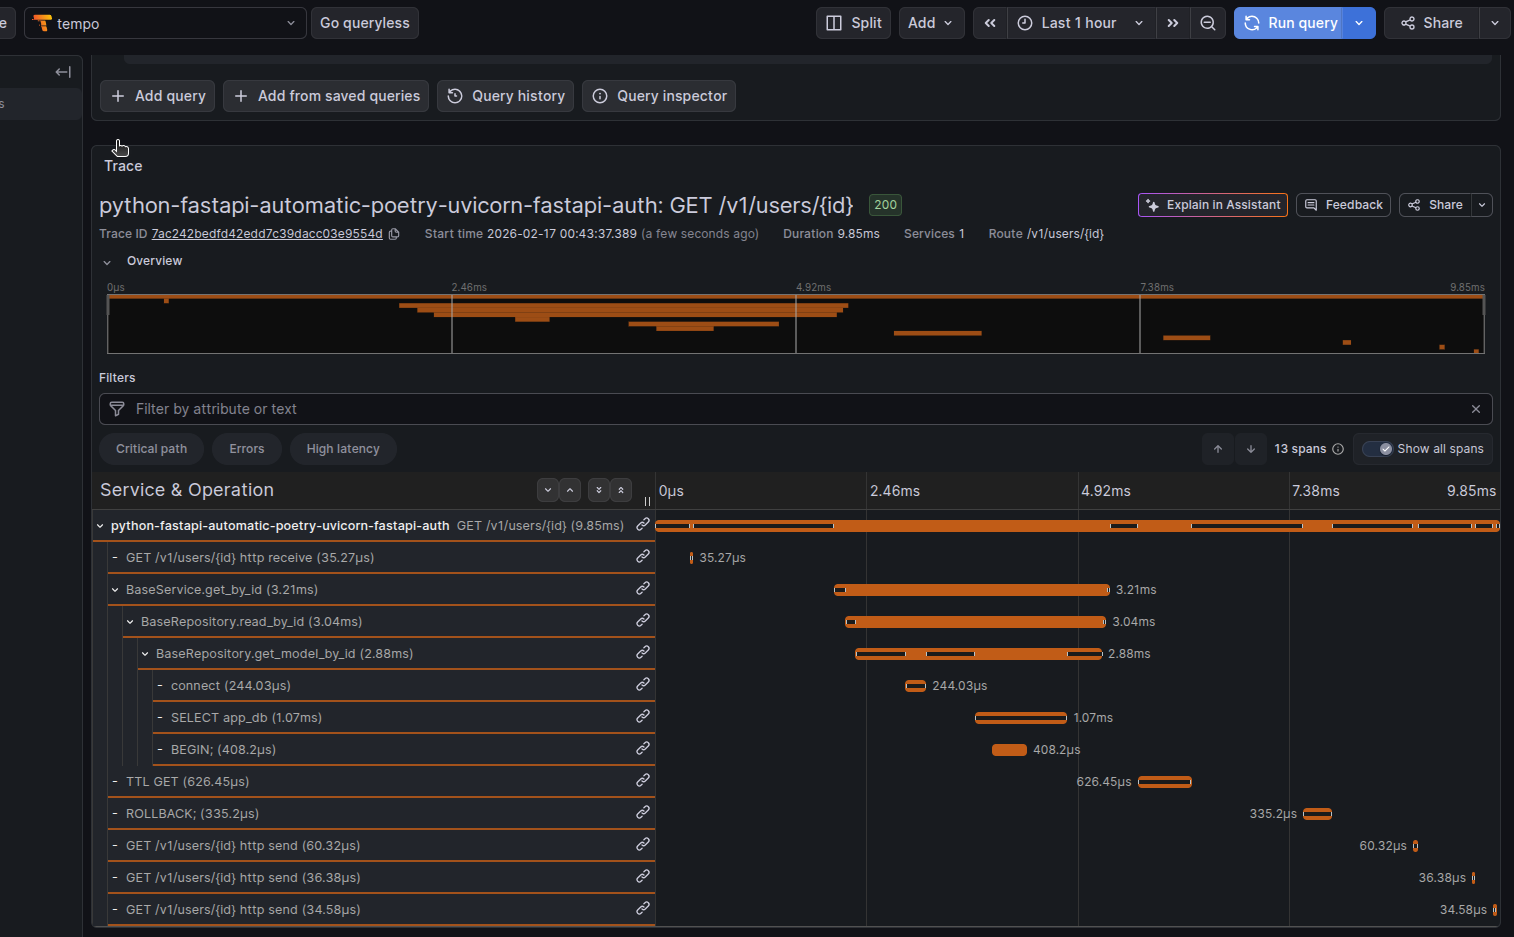
Table of contents
Open Table of contents
- What Gets Instrumented Automatically
- The Minimal Stack
- Dependencies and Installation
- OpenTelemetry Bootstrap Flow
- Environment Configuration
- Prometheus Integration (Alternative Metrics Export)
- Understanding System Metrics
- Resource Attributes for Telemetry Enrichment
- Pyroscope: Linking Traces to Profiles
- Docker and Deployment
- Troubleshooting
- Bonus: Return Trace ID as Response Header
- References
What Gets Instrumented Automatically
When you run your application/api with opentelemetry-instrument, here’s what happens without a single line of code change:
💡 Note: Automatic instrumentation is just the foundation. You can always use the OpenTelemetry SDK directly to customize, extend, or manually instrument specific code paths exactly as you would with manual instrumentation. Think of this as the baseline; you can build on top of it.
FastAPI/ASGI Handler Instrumentation (also other frameworks such as flask, django and celery)
Every incoming HTTP request automatically generates:
- Request span with method, path, status code
- Request headers and query parameters captured
- Response headers and body size tracked
- Automatic context propagation for distributed tracing
asyncpg (PostgreSQL) Instrumentation
Database operations are wrapped:
- Each query wrapped in a child span
- SQL statement logged (sanitized by default)
- Query duration measured
- Connection pool metrics tracked
HTTP Client Instrumentation
Outgoing HTTP requests via httpx or requests:
- URL, method, status code captured
- Response time measured
- Request/response headers optional
- External service dependencies visible
Redis Instrumentation (aioredis)
Cache operations tracked:
- Redis command and key logged
- Operation duration measured
- Hit/miss patterns visible
- Connection pool metrics
AsyncIO Instrumentation
Async operations visibility:
- Task creation and completion tracked
- Context propagation through async boundaries
- Coroutine execution time measured
Supported Instrumentations (Complete List)
OpenTelemetry Bootstrap auto-discovers and installs instrumentation packages for the following libraries:
asyncio, asgi, asyncpg, click, dbapi, fastapi, grpc, httpx, logging, redis, requests, sqlite3, sqlalchemy, starlette, threading, urllib, wsgi
If any of these libraries are installed in your environment, their corresponding instrumentation package is automatically installed and activated.
The Minimal Stack
| Component | Purpose | Note |
|---|---|---|
| FastAPI + Uvicorn | Web framework | Full ASGI instrumentation built-in |
| OpenTelemetry Distro | Meta-package with all core components | Don’t cherry-pick; use the official bundle |
| OTLP Exporter | Sends traces, metrics, logs over the wire | gRPC protocol, widely supported |
| Pyroscope | (Optional) Links traces to CPU/memory profiles | Game-changer for finding bottlenecks |
Dependencies and Installation
Run the following command to install the appropriate packages:
poetry add opentelemetry-distro opentelemetry-exporter-otlp pyroscope-otel opentelemetry-instrumentation-system-metricsOR
Add to pyproject.toml
[tool.poetry.dependencies]
python = "^3.13"
fastapi = "^0.104.0"
uvicorn = "^0.24.0"

# OpenTelemetry core stack
opentelemetry-distro = ">=0.60b1,<0.61"
opentelemetry-exporter-otlp = ">=1.39.1,<2.0.0"

# System metrics (not auto-installed by bootstrap)
opentelemetry-instrumentation-system-metrics = ">=0.60b1,<0.61"

# Optional: Continuous profiling
pyroscope-otel = ">=0.4.1,<0.5.0"
What Each Package Does
-
opentelemetry-distro— Meta-package bundling all core components (tracer provider, context propagation, semantic conventions). Use this instead of cherry-picking individual packages. -
opentelemetry-exporter-otlp— Exports traces, metrics, and logs to OpenTelemetry Protocol (OTLP) compatible backends. Supports both gRPC (port 4317) and HTTP/Protobuf (port 4318). -
opentelemetry-instrumentation-system-metrics— Must be explicitly installed. The bootstrap command doesn’t auto-discover this package. It collects system-level CPU, memory, disk, and network metrics and adds them as attributes to traces. -
pyroscope-otel— Links OpenTelemetry traces to continuous profiling data. Each trace gets apyroscope.profile.idattribute that can be used to jump from a trace to the exact CPU/memory profile captured during that transaction. Optional but highly recommended.
OpenTelemetry Bootstrap Flow
The opentelemetry-instrument command uses bootstrap to discover and automatically configure instrumentation. Here’s the exact flow:
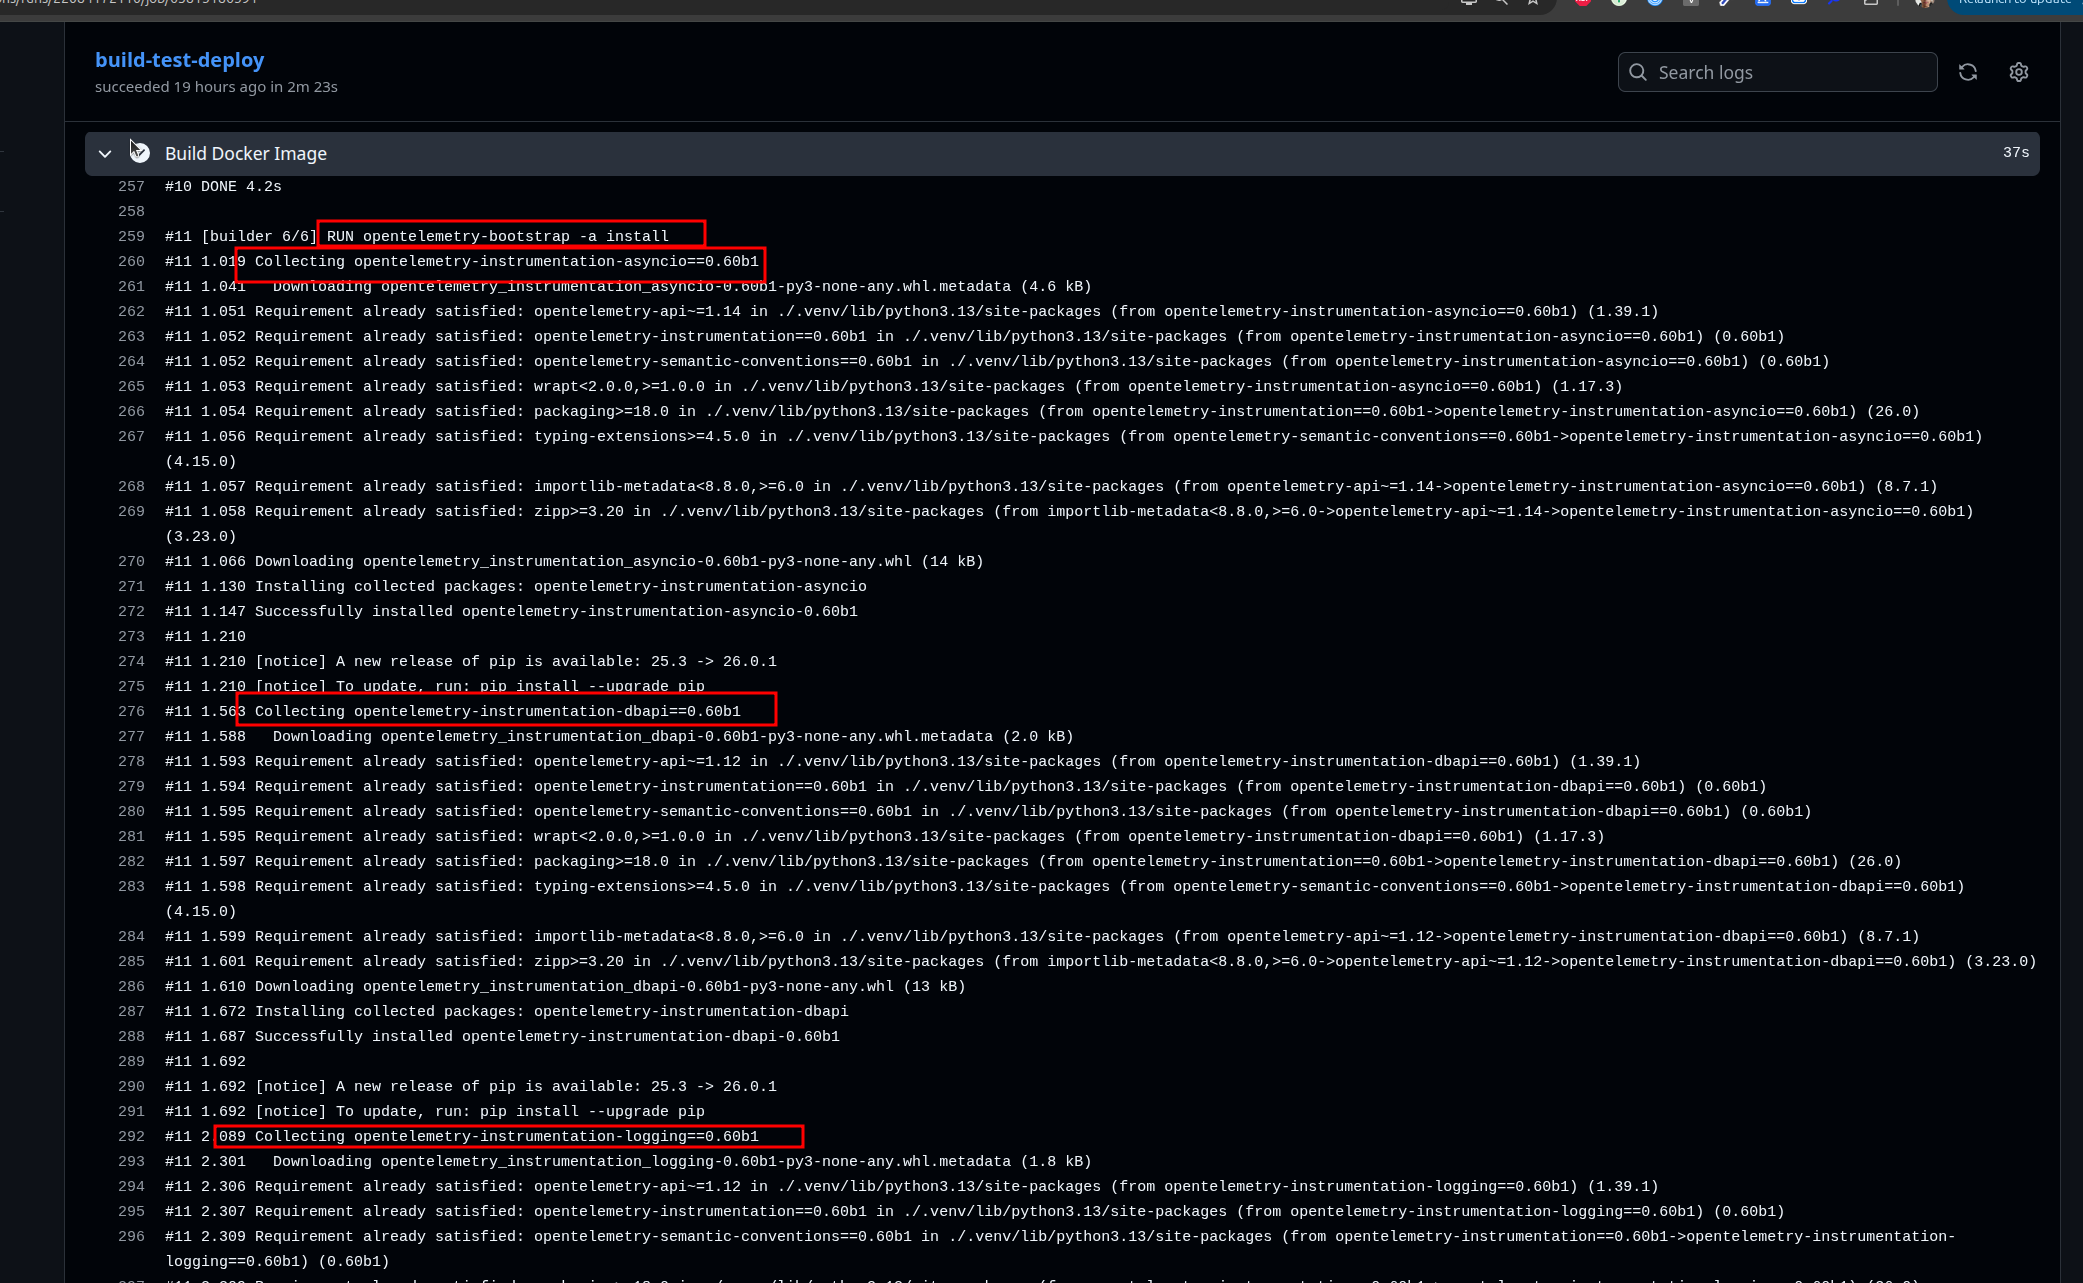
Step 1: Bootstrap Discovers Libraries
opentelemetry-bootstrap -a installThis command:
- Automatically installs latest
opentelemetry-instrumentation-*packages
⚠️ Alert: Bootstrap installs all available instrumentations for libraries it detects in your environment. If you have httpx, Redis, asyncpg, SQLAlchemy, etc., bootstrap will install instrumentation for all of them automatically. This can increase your Python package count. To disable specific instrumentations at runtime, use
OTEL_PYTHON_DISABLED_INSTRUMENTATIONS(see Environment Configuration).
Libraries auto-instrumented by bootstrap (if installed in your project):
opentelemetry-instrumentation-asgi(for FastAPI/Starlette)opentelemetry-instrumentation-asyncpg(for PostgreSQL queries)opentelemetry-instrumentation-redis(for aioredis)opentelemetry-instrumentation-httpx(for HTTP clients)opentelemetry-instrumentation-requests(for requests library)opentelemetry-instrumentation-asyncio(for async operations)opentelemetry-instrumentation-logging(for Python logging)
Step 2: Application Startup with Auto-Instrumentation
opentelemetry-instrument uvicorn --host 0.0.0.0 --port 8000 app.main:appWhen you run with opentelemetry-instrument, it imports all the discovered instrumentation packages and wraps library entry points before your application code even starts running. This means FastAPI, asyncpg, Redis, HTTP clients, and asyncio tasks are all intercepted automatically. The beautiful part: you don’t change a single line of your code. Your FastAPI routes, database queries, and HTTP calls all stay exactly as they were.
Step 3: Telemetry Collection Begins
Once requests start flowing through your application, the magic happens. You get traces showing the full path (request → database queries → Redis operations → HTTP calls → response), metrics tracking request rates and latency percentiles, logs enriched with trace context so you can correlate them with spans, and if you enabled Pyroscope, CPU and memory profiles that line up with specific traces.
Step 4: Export via OTLP
Everything collected goes straight to the endpoint you specified in OTEL_EXPORTER_OTLP_ENDPOINT. The data can be sent via gRPC (efficient and binary) or HTTP/Protobuf (more compatible). Batching happens automatically to avoid overwhelming your collector, and sampling is applied to keep data volumes manageable.
Environment Configuration
Core Configuration Variables
# Service Identity
OTEL_SERVICE_NAME="my-fastapi-service"
# The service name that appears in all observability platforms.
# Use lowercase with hyphens. This is your primary identifier.

OTEL_SERVICE_NAMESPACE="production"
# Groups related services in dashboards. Use: production, staging, development.
# All services with the same namespace appear together in the UI.

OTEL_SERVICE_VERSION="1.0.0"
# Semantic version of your service. Used to correlate issues with deployments.
# Format: MAJOR.MINOR.PATCH

# OTLP Exporter Configuration
OTEL_EXPORTER_OTLP_ENDPOINT="http://localhost:4317"
# The collector address where traces, metrics, and logs are sent.
# Format: <protocol>://<host>:<port>
# Common ports: 4317 (gRPC, default), 4318 (HTTP/Protobuf)
# In Kubernetes: http://otel-collector.observability.svc.cluster.local:4317

OTEL_EXPORTER_OTLP_PROTOCOL="grpc"
# Protocol for sending telemetry data.
# "grpc"          = gRPC binary protocol (port 4317, ~3x smaller payload, lower latency)
# "http/protobuf" = HTTP with Protobuf (port 4318, better firewall compatibility)
# CRITICAL: Protocol must match the collector's listening port!
# ✅ gRPC protocol → port 4317
# ✅ HTTP protocol → port 4318
# ❌ Mixed ports/protocols = connection timeouts

OTEL_EXPORTER_OTLP_INSECURE="true"
# Controls TLS/SSL certificate validation.
# "true"  = Skip certificate validation (development, self-signed certs)
# "false" = Validate certificate (production with HTTPS)
# In production with proper certificates, set to false or omit (defaults to false).

# Export Target Selection
OTEL_TRACES_EXPORTER="otlp"
# Which exporter backend to use for traces.
# "otlp" = OpenTelemetry Protocol (recommended)
# "jaeger", "zipkin" = Alternative backends (less common)

OTEL_METRICS_EXPORTER="otlp"
# Which exporter backend to use for metrics.
# "otlp" = OpenTelemetry Protocol
# "prometheus" = Prometheus scraping (not used here; we use push-based OTLP)

OTEL_LOGS_EXPORTER="otlp"
# Which exporter backend to use for logs.
# "otlp" = Push logs to collector
# "logging" = Write to Python's logging module (development only)

# Python-Specific Auto-Instrumentation
OTEL_PYTHON_LOGGING_AUTO_INSTRUMENTATION_ENABLED="true"
# Automatically enriches Python logs with trace context (trace ID, span ID).
# When enabled, every log entry includes the current trace/span for correlation.

OTEL_PYTHON_LOG_LEVEL="INFO"
# Logging level for OpenTelemetry's internal debug output.
# Levels: DEBUG (verbose), INFO (normal), WARNING (quiet), ERROR (very quiet)
# Use DEBUG when troubleshooting missing traces/metrics.

# Instrumentation Control
OTEL_PYTHON_DISABLED_INSTRUMENTATIONS="click,grpc"
# Comma-separated list of instrumentations to skip (no "opentelemetry-instrumentation-" prefix).
# Use this to reduce overhead if you don't use certain libraries.
# Available: asyncio, asyncpg, asgi, click, dbapi, fastapi, grpc, httpx, logging, redis, requests, sqlite3, sqlalchemy, starlette, threading, urllib, wsgi

OTEL_INSTRUMENTATION_HTTP_EXCLUDED_URLS="/health,/metrics,/ready"
# URLs to exclude from HTTP instrumentation (comma-separated).
# Prevents noise from health check endpoints.
# Each request to these URLs won't generate traces/metrics.

# Sampling Configuration
OTEL_TRACES_SAMPLER="parentbased_always_on"
# Sampling strategy.
# "always_on" = Keep all traces (high volume, good for debugging)
# "always_off" = Drop all traces (testing only)
# "parentbased_always_on" = If parent sampled, keep child; otherwise follow probability
# "parentbased_trace_id_ratio" = Parent-based with probability ratio

OTEL_TRACES_SAMPLER_ARG="1.0"
# Sampling rate when using ratio-based samplers.
# "1.0" = 100% sampling (keep all traces)
# "0.1" = 10% sampling (keep 1 in 10 traces)
# "0.01" = 1% sampling (cost reduction at scale)

# Pyroscope Configuration (Optional)
PYROSCOPE_SERVER_ADDRESS="http://localhost:4040"
# Grafana Pyroscope server address for continuous profiling.
# Profiles are sampled at 100Hz (100 samples per second) by default.
# Only used if pyroscope-otel is installed and initialized in your app.

PYROSCOPE_AUTH_TOKEN=""
# Authentication token for Grafana Cloud Pyroscope.
# Leave empty for local/self-hosted Pyroscope.
# Required for cloud.grafana.com/pyroscope.
OTLP Protocol Configuration Examples
gRPC Protocol (Recommended):
OTEL_EXPORTER_OTLP_ENDPOINT="http://otel-collector:4317"
OTEL_EXPORTER_OTLP_PROTOCOL="grpc"
OTEL_EXPORTER_OTLP_INSECURE="true"
HTTP/Protobuf Protocol (Better Firewall Compatibility):
OTEL_EXPORTER_OTLP_ENDPOINT="http://otel-collector:4318"
OTEL_EXPORTER_OTLP_PROTOCOL="http/protobuf"
OTEL_EXPORTER_OTLP_INSECURE="true"
Production with HTTPS:
OTEL_EXPORTER_OTLP_ENDPOINT="https://otel-collector.example.com:4317"
OTEL_EXPORTER_OTLP_PROTOCOL="grpc"
OTEL_EXPORTER_OTLP_INSECURE="false"
Prometheus Integration (Alternative Metrics Export)
By default, OpenTelemetry exports metrics to your OTLP collector. But you have options. If you want to expose metrics in Prometheus format and scrape them, you can configure it like this:
OTEL_METRICS_EXPORTER=prometheus
OTEL_EXPORTER_PROMETHEUS_PORT=9464
This exposes metrics at http://localhost:9464/metrics in Prometheus format. Your Prometheus scraper can then pull from that endpoint.
Push vs. Pull Metrics
You can choose how metrics are exported:
Push (OTLP - Recommended):
- Metrics are actively sent to the collector
- More efficient; no polling overhead
- Better for serverless environments
- Default: uses
OTEL_METRICS_EXPORTER=otlp
Pull (Prometheus):
- Prometheus scrapes your
/metricsendpoint periodically - More traditional approach
- Requires Prometheus instance configured to scrape your service
- Uses
OTEL_METRICS_EXPORTER=prometheus
Recommendation: Use Default + System Metrics
Here’s a practical tip: stick with the default OTLP push-based approach combined with system metrics. With opentelemetry-instrumentation-system-metrics installed and OTEL_METRICS_EXPORTER=otlp, you get CPU, memory, disk, and network metrics automatically attached to every trace without any scraping complexity. This is more than sufficient for most applications and you avoid the operational overhead of Prometheus scraping.
If you already have Prometheus running and want to use it, the Prometheus option is there. But for greenfield projects, OTLP + system metrics is simpler and more powerful.
Understanding System Metrics
By default, without opentelemetry-instrumentation-system-metrics, OpenTelemetry collects metrics from your application’s instrumented libraries:
- HTTP Metrics: Request count, latency (p50/p99), status code distribution
- Database Metrics: Query count, latency, connection pool usage (from asyncpg instrumentation)
- Cache Metrics: Redis operations, hit/miss ratio (from aioredis instrumentation)
- Runtime Metrics: Memory allocations, garbage collection events (from Python instrumentation)
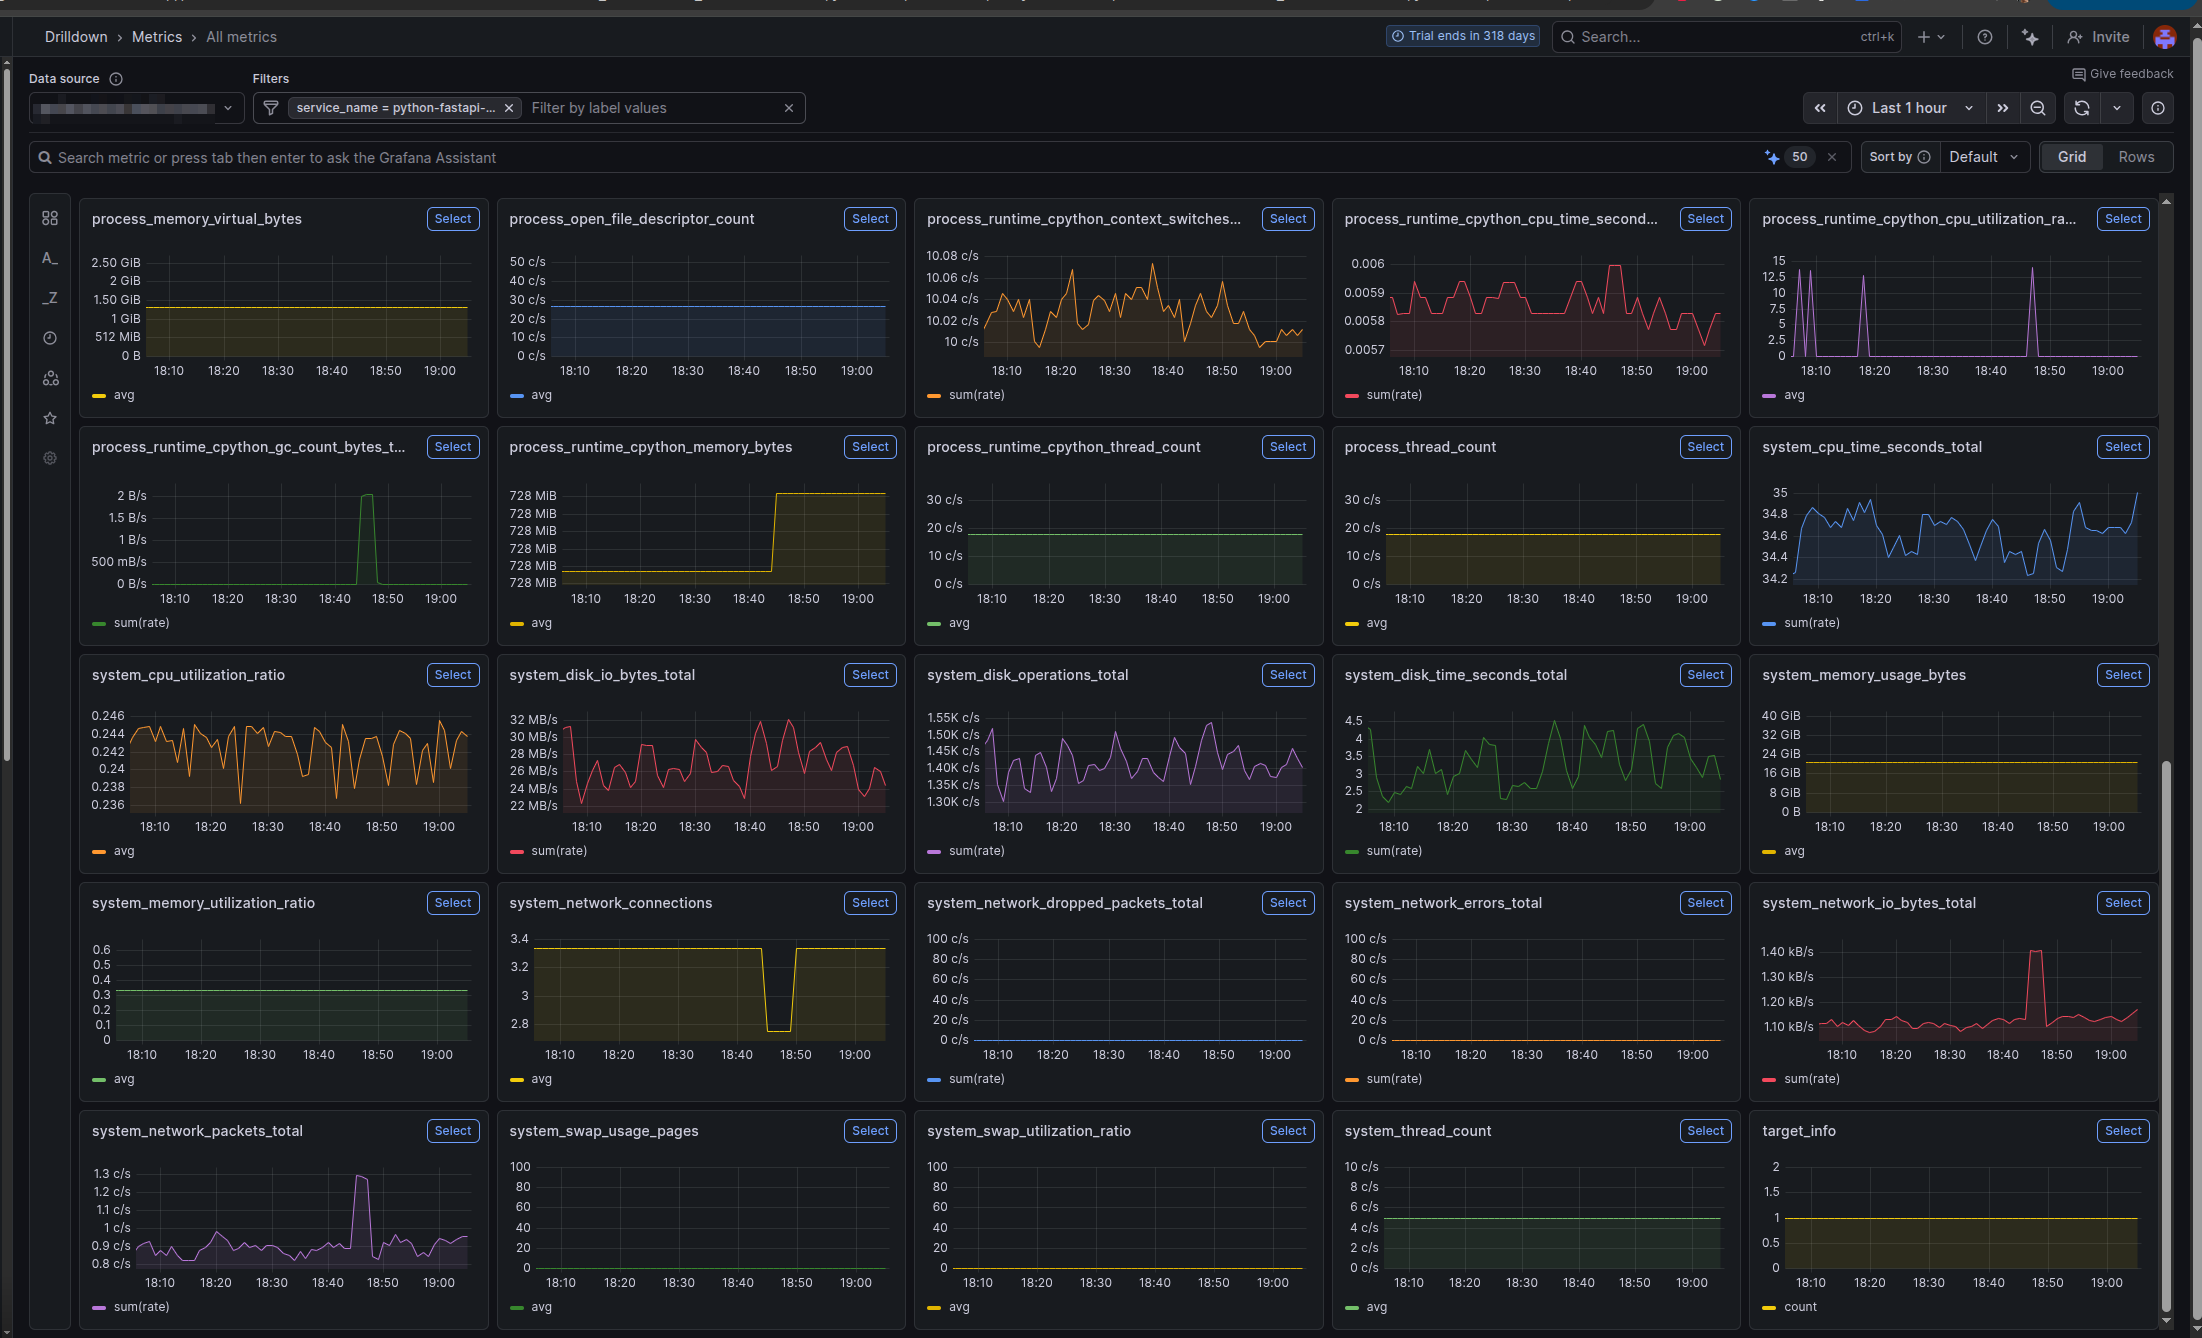
What System Metrics Adds
With opentelemetry-instrumentation-system-metrics explicitly installed, you get OS-level metrics added to every trace:
| Metric | What It Measures | Why It Matters |
|---|---|---|
system.cpu.usage | CPU utilization at trace time | Correlate slow requests with high CPU |
system.cpu.time | CPU time (user + system) | Distinguish between I/O wait vs CPU burn |
system.memory.usage | Memory consumption (RSS) | Detect memory leaks or spikes |
system.memory.limit | Available memory | Context for memory pressure |
system.disk.io.bytes_read | Bytes read from disk | Trace disk I/O patterns |
system.disk.io.bytes_written | Bytes written to disk | Identify excessive logging/writing |
system.network.io.bytes_sent | Bytes sent on network | Monitor bandwidth usage per request |
system.network.io.bytes_recv | Bytes received on network | Detect large payload transfers |
These become attributes on the root span, so when you query “why is this trace slow?”, you can immediately see: “CPU was at 85%, memory at 2GB”.
📋 Complete List: For the full list of available system metrics and their definitions, see otel-metrics-list.md in the template repository.
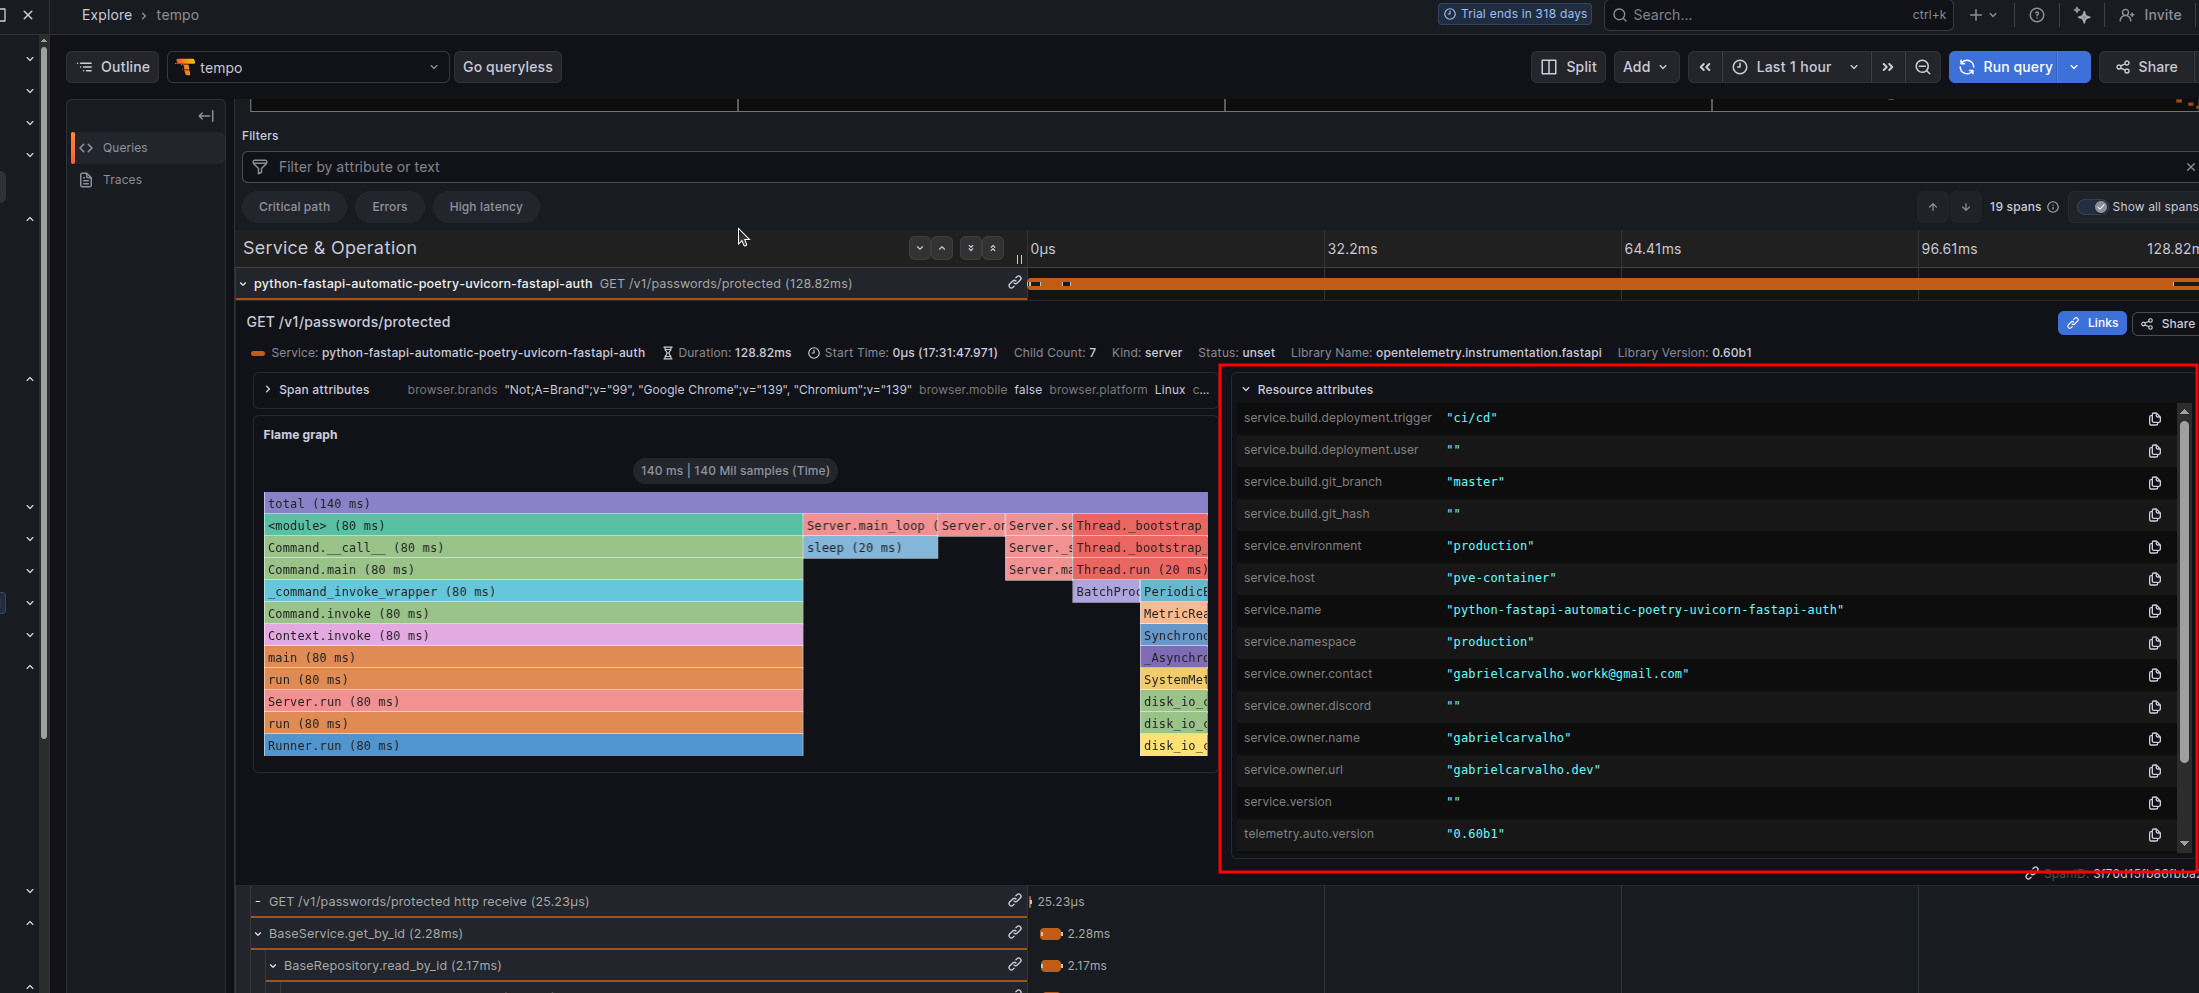
Resource Attributes for Telemetry Enrichment
Resource attributes provide metadata about your service that appear on every single trace, metric, and log. They’re not collected data; they’re descriptive context that enriches your telemetry.
Use them to tag your environment, version, team, and deployment information so you can filter and correlate issues.
Configuration via Environment Variables
Set the OTEL_RESOURCE_ATTRIBUTES environment variable with comma-separated key-value pairs:
export OTEL_RESOURCE_ATTRIBUTES="\
service.namespace=production,\
service.environment=production,\
service.version=1.0.0,\
service.build.git_hash=abc123def456,\
service.build.git_branch=main,\
service.owner.name=backend-team,\
service.owner.contact=backend @ company.com"
Attribute Reference
| Attribute | Example | Purpose |
|---|---|---|
service.namespace | production | Environment grouping. All services with same namespace appear together in dashboards. |
service.environment | production | Environment name. Allows filtering by prod/staging/dev. |
service.version | 1.0.0 | Semantic version. Used to correlate issues with specific releases. |
service.host | api-pod-01 | Physical/logical host. Helps identify which instance had the issue. |
service.build.git_hash | abc123def456 | Git commit SHA. Allows jumping to exact code that was deployed. |
service.build.git_branch | main | Git branch. Useful for canary deployments tracking. |
service.build.deployment.user | ci-bot | Who triggered the deployment. Useful for incident correlation. |
service.build.deployment.trigger | github-actions | How deployment was triggered. Helps identify bad deploys. |
service.owner.name | Backend Team | Team responsible for the service. Important for on-call routing. |
service.owner.contact | backend @ company.com | Primary contact email. Used in alerting. |
Docker/Deployment Integration
Set these environment variables in your CI/CD pipeline before deploying:
# Example for GitHub Actions
export OTEL_SERVICE_NAMESPACE="production"
export OTEL_SERVICE_VERSION="1.0.0"
export SERVICE_BUILD_GIT_HASH="abc123def456"      # Set from CI: ${{ github.sha }}
export SERVICE_BUILD_GIT_BRANCH="main"             # Set from CI: ${{ github.ref_name }}
export SERVICE_BUILD_DEPLOYMENT_USER="ci-bot"     # Set from CI: ${{ github.actor }}
export SERVICE_BUILD_DEPLOYMENT_TRIGGER="github-actions"
export SERVICE_OWNER_NAME="backend-team"
Then in your deployment script or Dockerfile:
ENV OTEL_RESOURCE_ATTRIBUTES="\
service.namespace=${OTEL_SERVICE_NAMESPACE},\
service.version=${OTEL_SERVICE_VERSION},\
service.build.git_hash=${SERVICE_BUILD_GIT_HASH},\
service.build.git_branch=${SERVICE_BUILD_GIT_BRANCH},\
service.build.deployment.user=${SERVICE_BUILD_DEPLOYMENT_USER},\
service.build.deployment.trigger=${SERVICE_BUILD_DEPLOYMENT_TRIGGER},\
service.owner.name=${SERVICE_OWNER_NAME}"
Or in CI/CD (GitHub Actions example):
env:
  OTEL_SERVICE_VERSION: "1.0.0"
  SERVICE_BUILD_GIT_HASH: ${{ github.sha }}
  SERVICE_BUILD_GIT_BRANCH: ${{ github.ref_name }}
  SERVICE_BUILD_DEPLOYMENT_USER: ${{ github.actor }}
  SERVICE_BUILD_DEPLOYMENT_TRIGGER: "github-actions"
Pyroscope: Linking Traces to Profiles
Traces tell you what happened and how long it took. Profiles tell you where the CPU and memory were spent.
The Problem Pyroscope Solves
A slow trace looks like:
POST /api/expensive-operation - 1500ms
├─ database query - 200ms (asyncpg)
├─ external API call - 300ms (httpx)
└─ processing - 1000ms ??? (where is the time going?)
Traces can’t answer “what’s happening in that 1000ms processing?” Profiling can:
process_data()
├─ heavy_computation() - 600ms CPU
│ └─ numpy_array_operation() - 580ms
└─ data_transformation() - 400ms CPU
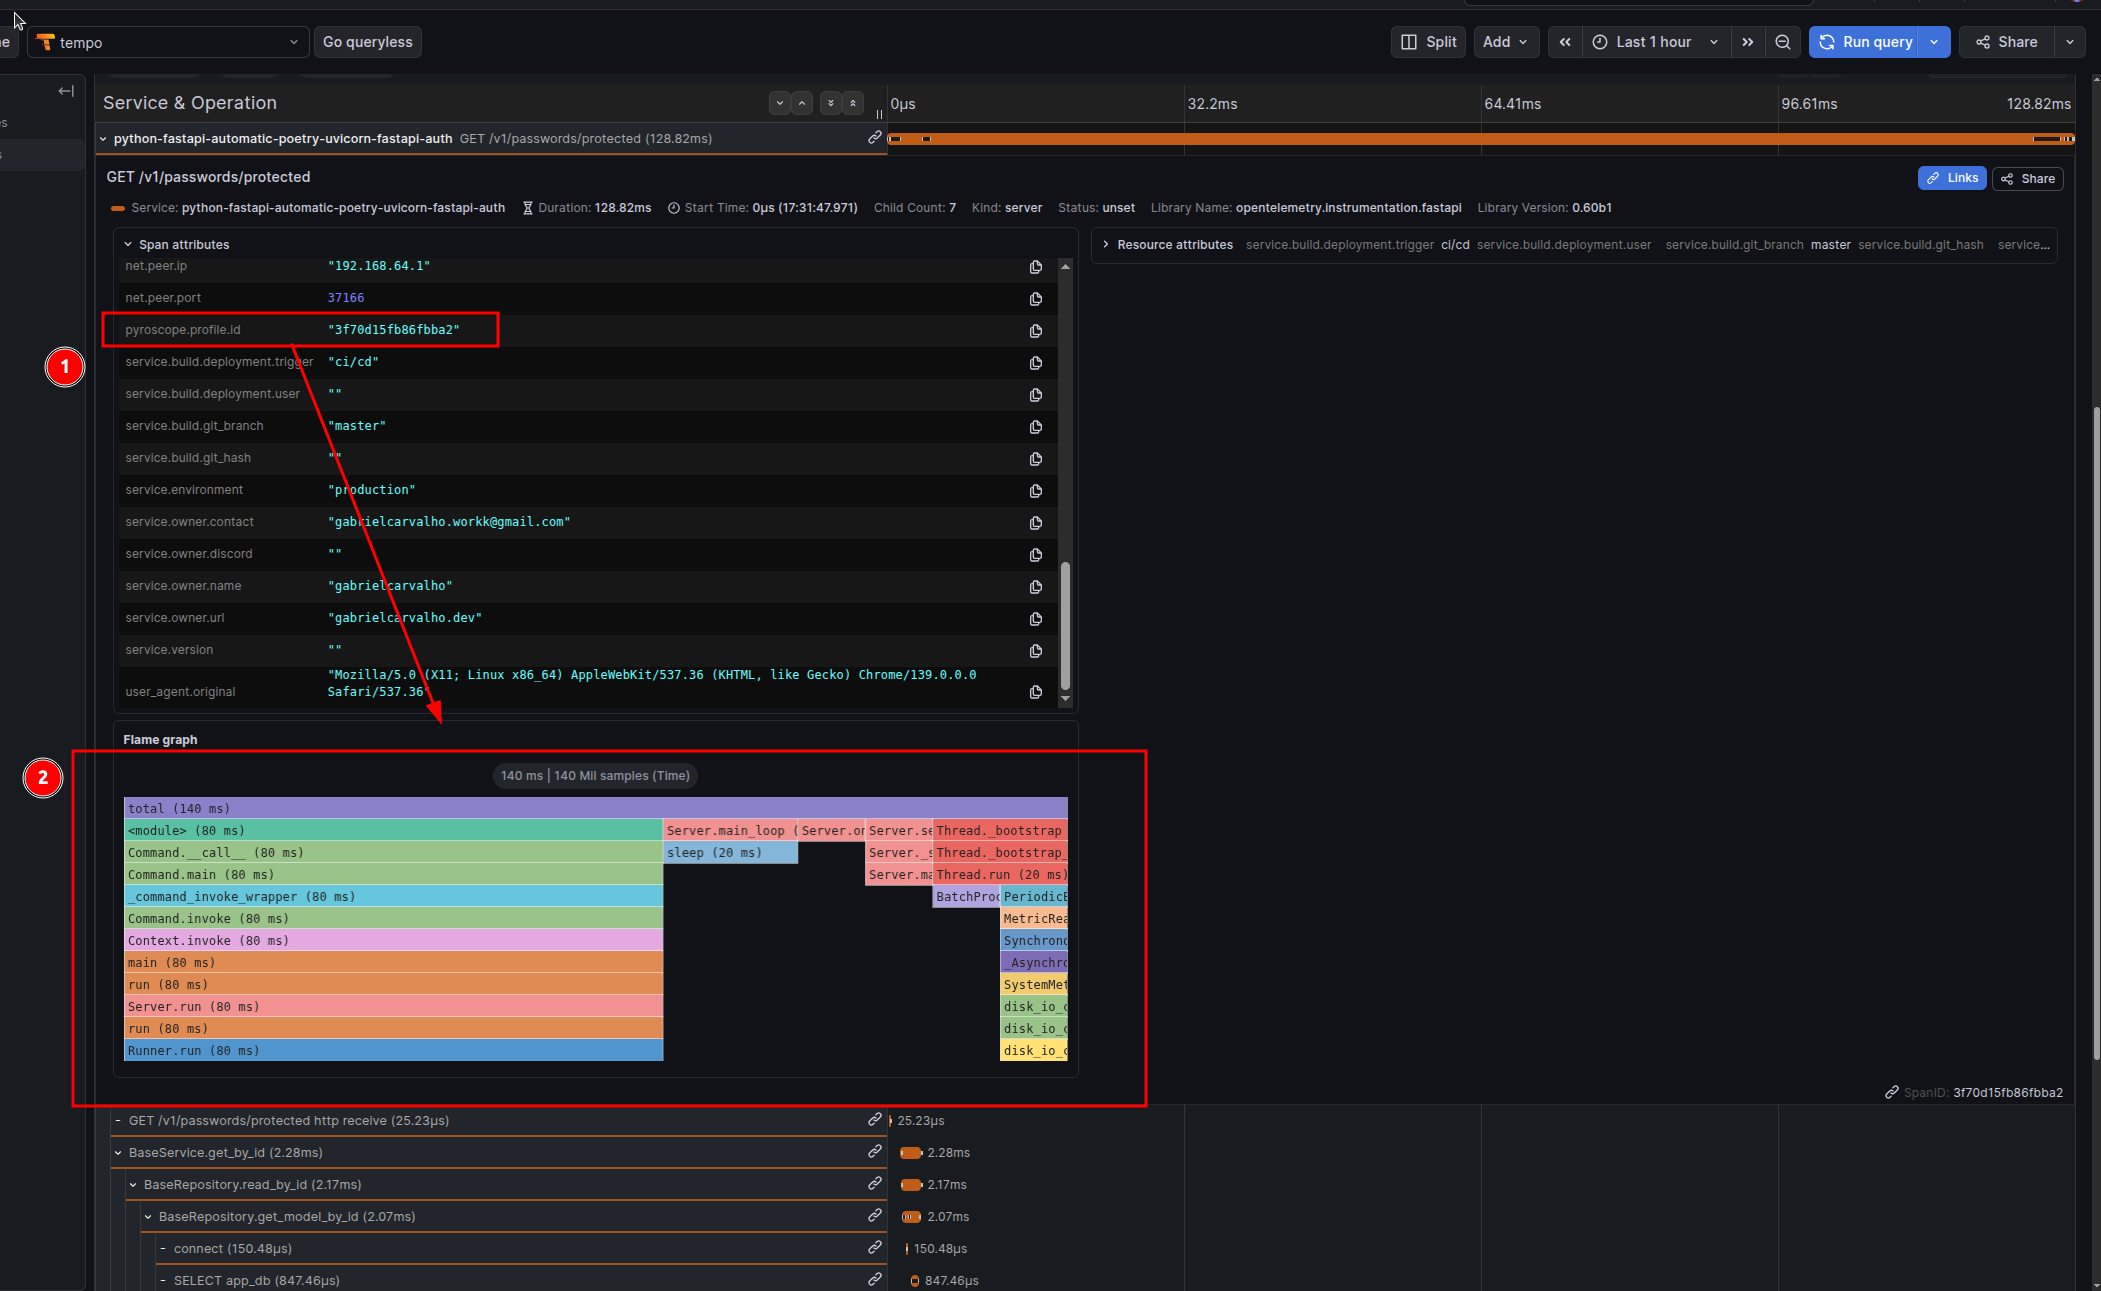
└─ json_serialization() - 380msWith Pyroscope + OpenTelemetry, each trace automatically gets a link to the profile captured during that trace’s execution window. Click “View Profile” in your trace and see the exact call stack where CPU/memory was spent.
How Pyroscope Integration Works
When you install and configure pyroscope-otel, the PyroscopeSpanProcessor does this:
- Captures profiles continuously across your entire application
- At trace creation time, the processor attaches the
pyroscope.profile.idattribute to the root span of each trace (not individual spans — the entire transaction) - The profile ID is a reference to the time window when that trace was executing
- In Grafana Tempo (or compatible observability platform), you see a “View Profile” button that jumps directly to the profile segment
Example trace attributes with Pyroscope:
{
  "trace_id": "abc123...",
  "span_id": "root_span_001",
  "service.name": "my-fastapi-service",
  "http.route": "/api/expensive-operation",
  "pyroscope.profile.id": "cpu:my-fastapi-service{}2025-01-24T10:30:00Z",
}
Initialization
Add this to app/main.py at module level, before FastAPI app creation:
import os
import pyroscope
from pyroscope.otel import PyroscopeSpanProcessor
from opentelemetry import trace
from opentelemetry.sdk.trace import TracerProvider

# Configure Pyroscope FIRST (required before any spans are created)
pyroscope.configure(
    app_name=os.getenv("OTEL_SERVICE_NAME", "my-fastapi-service"),
    server_address=os.getenv("PYROSCOPE_SERVER_ADDRESS", "http://localhost:4040"),
    # Optional: for Grafana Cloud
    # auth_token=os.getenv("PYROSCOPE_AUTH_TOKEN", ""),
)

# Register Pyroscope with OpenTelemetry
# This ensures the profile ID is attached to every root span
if hasattr(trace, 'get_tracer_provider'):
    provider = trace.get_tracer_provider()
    if isinstance(provider, TracerProvider):
        provider.add_span_processor(PyroscopeSpanProcessor())

# Now safe to create FastAPI app
from fastapi import FastAPI
app = FastAPI()
Critical: Pyroscope must be initialized before the first request. If you configure it after FastAPI starts, span profiles won’t be captured or linked. Put this at module level.
Important: Profile Linking is at Trace Level
The PyroscopeSpanProcessor attaches pyroscope.profile.id to the root span (the top-level span wrapping the entire request). Child spans inherit this attribute via context propagation, but the actual profile data is captured for the entire transaction duration, not individual operations.
This design makes sense: you want to see “what was the CPU profile while this entire request was executing?” not “what was the CPU profile just for this one database query?”
Docker and Deployment
Multi-Stage Build (Production-Ready)
This approach separates dependency compilation from runtime, reducing the final image size:
FROM cgr.dev/chainguard/wolfi-base as builder

RUN apk add --no-cache python-3.13 py3.13-pip poetry

ENV POETRY_NO_INTERACTION=1 \
    POETRY_VIRTUALENVS_IN_PROJECT=1 \
    POETRY_VIRTUALENVS_CREATE=1 \
    POETRY_CACHE_DIR=/tmp/poetry_cache

WORKDIR /app/

COPY pyproject.toml poetry.lock ./

RUN --mount=type=cache,target=$POETRY_CACHE_DIR \
    poetry install --without dev --no-root

ENV PATH="/app/.venv/bin:$PATH"

# Install OpenTelemetry instrumentation packages for all detected libraries
RUN opentelemetry-bootstrap -a install


FROM cgr.dev/chainguard/wolfi-base as runtime

RUN apk add --no-cache python-3.13

ENV VIRTUAL_ENV=/app/.venv \
    PATH="/app/.venv/bin:$PATH"

COPY --from=builder ${VIRTUAL_ENV} ${VIRTUAL_ENV}

COPY app ./app
COPY pyproject.toml poetry.lock ./

EXPOSE 8000

# Start with opentelemetry-instrument wrapper for automatic instrumentation
CMD ["sh", "-c", "opentelemetry-instrument uvicorn --proxy-headers --host 0.0.0.0 --port 8000 app.main:app"]
Image Size Comparison
With Pyroscope (Wolfi base): ~240MB
- Includes
libgc(required by Pyroscope for garbage collection profiling) - All OpenTelemetry instrumentation packages
Without Pyroscope (Alpine base): ~180MB
- Lightweight base image
- Still includes full OpenTelemetry instrumentation
- Pyroscope won’t work on Alpine (missing
libgc)
Switching to Alpine (If Not Using Pyroscope)
If you don’t need continuous profiling and want a smaller image:
FROM python:3.13-alpine as builder
# ... same builder stage ...

FROM python:3.13-alpine as runtime
RUN apk add --no-cache libpq

# ... same runtime setup ...
# Final image size: ~150MB
Remove pyroscope-otel from pyproject.toml when using Alpine.
Troubleshooting
Traces Not Appearing in Backend
Protocol/Port Mismatch:
# Check your collector's listening ports
docker logs otel-collector | grep -i listen

# Test connectivity
curl -i http://localhost:4317  # gRPC (binary, no HTTP response)
curl -i http://localhost:4318  # HTTP/Protobuf (will respond)
Protocol must match port:
- gRPC protocol → port 4317
- HTTP/Protobuf protocol → port 4318
If using gRPC on port 4318 (or vice versa), you’ll get connection timeouts with no traces.
Enable debug logging:
OTEL_PYTHON_LOG_LEVEL=DEBUG opentelemetry-instrument uvicorn app.main:appPyroscope Profile ID Missing from Spans
Symptoms: Traces appear, but pyroscope.profile.id attribute is missing.
Root causes:
-
Pyroscope initialized after first request:
# ❌ WRONG: Initialized in a route handler @app.on_event("startup") async def startup(): pyroscope.configure(...) # Too late! # ✅ CORRECT: Module-level initialization pyroscope.configure(...) from fastapi import FastAPI app = FastAPI() -
PyroscopeSpanProcessor not registered:
# Verify this is in your app startup provider.add_span_processor(PyroscopeSpanProcessor()) -
Pyroscope server unreachable:
curl -i http://localhost:4040
libgc Not Found Error (Alpine + Pyroscope)
Error: libgc: No such file or directory when Pyroscope initializes.
Solution: Alpine doesn’t include the garbage collector library. Use Wolfi base image instead:
# ✅ CORRECT
FROM cgr.dev/chainguard/wolfi-base as runtime
RUN apk add --no-cache python-3.13

# ❌ WRONG (Pyroscope fails at runtime)
FROM python:3.13-alpine
If you want Alpine, remove Pyroscope from dependencies.
System Metrics Not Appearing
Missing in attributes: system.cpu.usage, system.memory.usage, etc.
Cause: opentelemetry-instrumentation-system-metrics not installed.
Fix with Poetry:
# Add to pyproject.toml
opentelemetry-instrumentation-system-metrics = ">=0.60b1,<0.61"
Then run:
opentelemetry-bootstrap -a installOr install manually:
poetry add opentelemetry-instrumentation-system-metricsBootstrap Installing Too Many Packages
If opentelemetry-bootstrap is bloating your image and you don’t need all instrumentations:
Option 1: Disable at runtime
OTEL_PYTHON_DISABLED_INSTRUMENTATIONS="asyncio,click,grpc,threading,urllib"
opentelemetry-instrument uvicorn app.main:app
Option 2: Manual installation in Dockerfile
# Skip bootstrap, install only what you need
RUN pip install \
    opentelemetry-instrumentation-fastapi \
    opentelemetry-instrumentation-asyncpg \
    opentelemetry-instrumentation-redis \
    opentelemetry-instrumentation-httpx \
    opentelemetry-instrumentation-asyncio
Then use opentelemetry-instrument normally — it will activate only the installed instrumentations.
Certificate Validation Errors (HTTPS)
Error: SSL: CERTIFICATE_VERIFY_FAILED
For self-signed certificates (development):
OTEL_EXPORTER_OTLP_INSECURE="true"For production with proper certificates:
OTEL_EXPORTER_OTLP_INSECURE="false"
# (or omit, as false is default)
Multiple Workers with Pre-fork Servers
Problem: Running Gunicorn with multiple workers breaks metric export because forking creates inconsistencies in background threads and locks used by OpenTelemetry’s PeriodicExportingMetricReader.
Symptoms:
- Traces export fine, but metrics stop appearing
- Deadlocks in child processes after fork
- Metrics work with single worker, fail with
--workers 4
Solution: Use Gunicorn + UvicornWorker
Instead of:
# ❌ BROKEN: Metrics won't export with multiple workers
gunicorn myapp.main:app --workers 4
Use:
# ✅ CORRECT: UvicornWorker preserves background threads
opentelemetry-instrument gunicorn \
  --workers 4 \
  --worker-class uvicorn.workers.UvicornWorker \
  --bind 0.0.0.0:8000 \
  myapp.main:app
The UvicornWorker class is specifically designed to handle forks while preserving background processes and threads. This ensures:
- Traces export correctly ✓
- Metrics export correctly ✓
- Logs export correctly ✓
- No deadlocks ✓
Why this works: UvicornWorker manages the async event loop per worker, avoiding the thread/lock inconsistencies that occur with standard Gunicorn workers.
Alternative: If you don’t need multiple workers, stick with single-worker Uvicorn:
opentelemetry-instrument uvicorn --host 0.0.0.0 --port 8000 app.main:appBonus: Return Trace ID as Response Header
When debugging, users often ask “How do I find my request in the logs?” Returning the otel-trace-id header in the HTTP response solves this immediately. Users can provide the trace ID to support, and you can look it up in your observability platform.
FastAPI Middleware
Add this middleware to your app:
from fastapi import FastAPI, Request
from opentelemetry import trace

app = FastAPI()

@app.middleware("http")
async def add_trace_id_header(request: Request, call_next):
    # Get the current span's trace ID
    span = trace.get_current_span()
    trace_id = span.get_span_context().trace_id

    # Format as hex string (without leading zeros that hex() adds)
    trace_id_hex = format(trace_id, '032x')

    # Call the endpoint
    response = await call_next(request)

    # Add trace ID to response header
    response.headers["otel-trace-id"] = trace_id_hex

    return response
Usage:
curl -i http://localhost:8000/api/users

# Response headers:
# HTTP/1.1 200 OK
# ...
# otel-trace-id: abc123def456abc123def456abc123de
User reports: “I got error, trace ID is abc123def456abc123def456abc123de”
You search your Jaeger/Tempo UI for that trace ID and immediately see the full request timeline, database queries, external calls, and system metrics.
References
- OpenTelemetry Python Documentation
- OpenTelemetry Bootstrap
- Pyroscope Span Profiles
- OTLP Specification
- Chainguard Images
If you liked this post, have questions, or found issues in the setup, reach me on WhatsApp or email.